The defined benefit plan is constructed to make promised benefits for future events, well beyond the period for which management and control of the plan occur. The actuary is engaged on behalf of the plan to make their best estimate of future events that will determine benefit payments resulting from the promises made. Today’s promise of benefits may be payable 100 years in the future, depending on actions of the participants and of the plan sponsor.
That estimate requires a number of assumptions regarding the behavior of the participants—for economic trends, investment results, and behavior of the plan sponsors. This note addresses some of the assumptions made and looks at actual experience among a segment of the plan population. It highlights the uncertainty of prediction in the group studied, and notes the rationale for making simplified assumptions.
Background
There were two data sources used in this study: one for plans and one for participants.
The group of plans is derived from the 2017 and 2018 database file of the Department of Labor’s Employee Benefit Security Administration (EBSA) for Form 5500-SF selected as defined benefit (DB) or cash balance plans, as signified by the indication that they are subject to DB minimum funding standards. This does not include DB plans which have previously terminated or converted to other plan types, nor to fully insured DB plans. A total of 34,000 plans were studied, based on their reliance on DB minimum funding standards. From the nature of the group, plans solely covering self-employed individuals could not be included, either by filing Form 5500-EZ, or who use the single participant Form 5500-SF. Only plans that had a Form 5500 Schedule SB were included, eliminating those which were no longer subject to funding disclosures.
The information about the group of participants is derived from 180 pension plans administered by a single source. These plans include a small number of industries, with many of the plans for successful entrepreneurs or professional service providers, with the single largest concentration in medical services.
However, the largest number of records is derived from the hospitality industry, followed by health care, manufacturing, and legal services. The group is self-selected, since the employers chose to sponsor DB plans—motivated in large part by the tax deferral of income gained by the owners, and to a lesser extent to encourage employee retention for mid-sized plans. Compensation and termination data were from this source.
Areas of Observation
Among the assumptions made are:
- How long the plan will remain in effect.
- What variation in investment return can be expected, recognizing that economic data for the study period affects the entire economy.
- What compensation will be used to determine benefits.
- How long participants will remain in the plan.
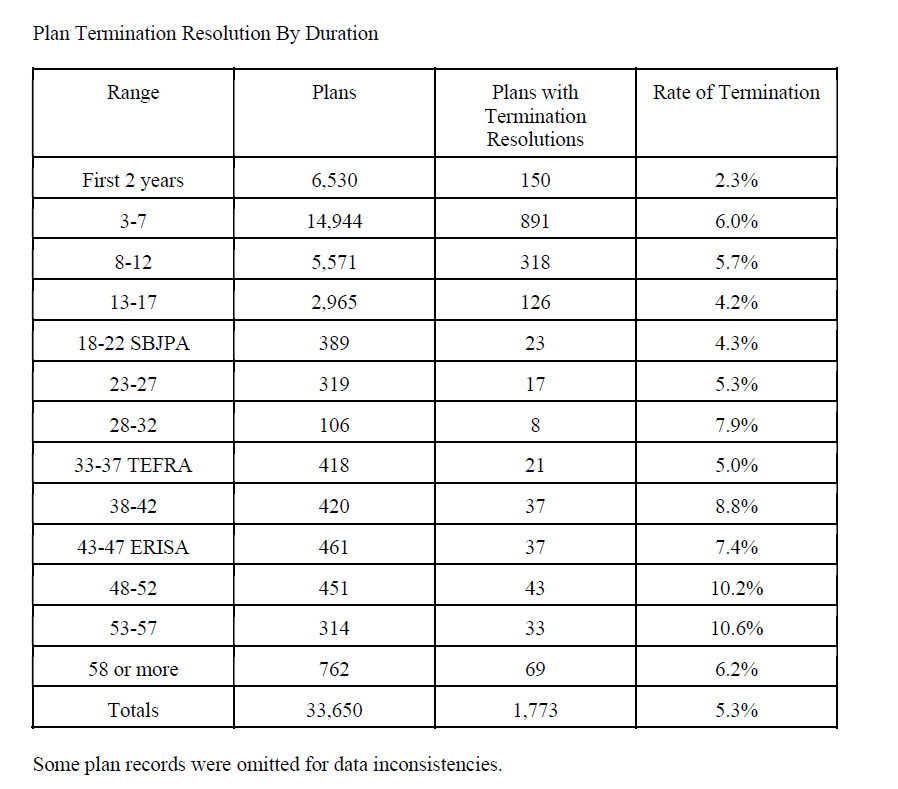
Plan Continuance and Termination
For the EBSA database, we can study the start and end of plans, remembering that this study only covers SF filers with DB attributes. We compile the number of plans by effective date, noting the subset of those plans with a resolution to terminate. This gives the range of time plans remain in effect and the rate of plan termination by length of time from effective date.
We also distinguish between plans for which the business code is usually for a form of professional service or medical service, compared to other forms. By business code, we separate the codes as follows:
- 541110 through 541990, professional service;
- 621111 to 621510, medical professionals; and
- 711100 to 71510, entertainers and athletes. Many of those plans only cover the individual business owner, and they do not file Form 5500-SF, and thus are not available to this study.
By industry, we have:
- 6,724 professional services;
- 11,788 medical services;
- 523 entertainment services; and 14,981 in all other categories.
Those with termination resolutions were:
- 324 professional (4.8%);
- 532 medical (4.5%);
- 25 entertainment (4.8%); and
- 88 other industries (5.9%).
The rate for the entire plan group was 5.2%.
For the study period of 2018, notable law changes took place in:
- 1996 (SBJPA), 22 years ago;
- 1984 (TEFRA), 34 years ago; and
- 1976 (ERISA effective date), 42 years ago.
By plan size:
- 17,774 micro size plans had five or fewer participants;
- 13,641 small size plans had 6 to 25 participants; and
- 2,601 mid-size plans had 26 or more participants.
Some SF filers had 100 or more by exemption due to prior size. Micro plans had 4.4% termination rates, small plans had 6.0%, while mid-sized plans had 6.7% terminating.
The Pension Benefit Guarantee Corporation (PBGC) was reported to cover 16,194 plans, 1,030 of which terminated (6.4%).
The average size of plan assets was $199,728 per participant, and terminating plans had an average $178,850 in assets per participant. In total, plan assets at the beginning of 2018 had $46.0 billion covering 444,619 participants for a weighted average of $103,483 per participant. For comparison, 565,802 other plans with 12,518,512 participants had an average asset of $60,126 per participant.
Within a larger context, 2018 was generally regarded as a prosperous year, with little economic disruption. Higher termination rates would be expected in other years, subject to a more extensive study.
Assumed and Actual Investment Returns in 2018
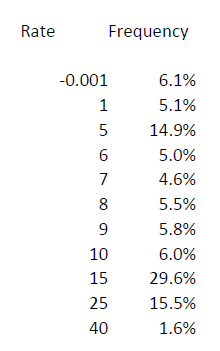
The effective rate used for valuation of private DB plans is a function of government-mandated rates as published by the IRS. It is also related to the expected future duration of future benefit payments. The actuary uses interest rates approved by the plan sponsor within a range of allowable rates. Drawing from the 5500-SB database, we observed both the actual returns reported for the prior year, and the effective rate used for the 2018 valuation. Further, we note the range and frequency of the most common choices of interest rate.
Filings of Form 34009 SB were found attached to Form 5500-SF; 34,004 of these reported their effective interest rate, with surprising results. A high value of 9.85% was reported, well above the maximum long-term rate in the regulations. The average rate was 5.48%, while the median rate was 5.56%.
Actual investment returns measured for 2017 are disclosed on the SB. The period included a growing economy and stock market, with lowering bond rates that also raised market values for the year. This still left the individual trusts with a wide range of results. However, the yield from the prior year is not always reported, as for new plans and possibly for plans that did not maintain a carryover balance or pre-funding balance for their funding standard account.
A total of 27,391 plans reported their prior investment yield. The average yield was 7.42%, but the median was 9.5%. Another 15,962 plans reported yields which exceeded their effective rate.
This chart shows the range of experience. “Rate” indicates actual yield as a percent, and “Frequency” indicates the percent of reporting plans that achieved a rate in the range. It reflects the 2017 experience of rising economic activity. An expanded study covering more years would also be useful.
Compensation
To investigate these items, about 8,000 years of employment records were available from plan records provided. They cover a period from the earliest year 1987 through 2019. Over 2,700 individuals were included.
About 6,200 records included compensation. The remainder either were terminated or had no records for the period. Among those with compensation records, 673 had later years with zero compensation, slightly more than 37%, leaving 63% who remained with the plan to the end of their observation period. Further records were excluded from the compensation study if: (1) the compensation was zero, (2) they were in the first year of plan records, or (3) the compensation records were not for continuous years. The resulting group whose compensation was studied came to 1,720 year-over-year comparisons.
Rates of compensation change were examined based on length of service. Age of participants was observed, but was not tabulated herein.
Variations in rate of change were shown as a spread of results, noting that the data has reasonable median and average values, but with wide variation in results, regardless of the correlation to years of service.
Some limitations in the study group should be noted:
- The duration until zero compensation occurred is a measure of time while employed, although it has several caveats.
- Many plans exclude compensation prior to entry into a plan, as this often eliminates data for pre-participation years.
- Years before a plan being administered by a service provider or third party administrator (TPA) are often omitted.
- The pay history for highly successful owner-employees is often limited to reflect the covered payroll, subject to the Internal Revenue Code Section 401(a)(17) limit. Further, a participant who has control over pay levels may have already established a high average pay for plan purposes and might have pay information omitted, or to select lower pay for tax purposes in later years.
- Hiring and termination of employment varies by industry and economic cycle. Further, for owner-employees, the termination of employment is closely related to plan termination, as plans usually cease operation when the plan sponsor closes the business.
This table shows the observed changes in compensation measured as a percent of prior pay, based on the range of changes observed.
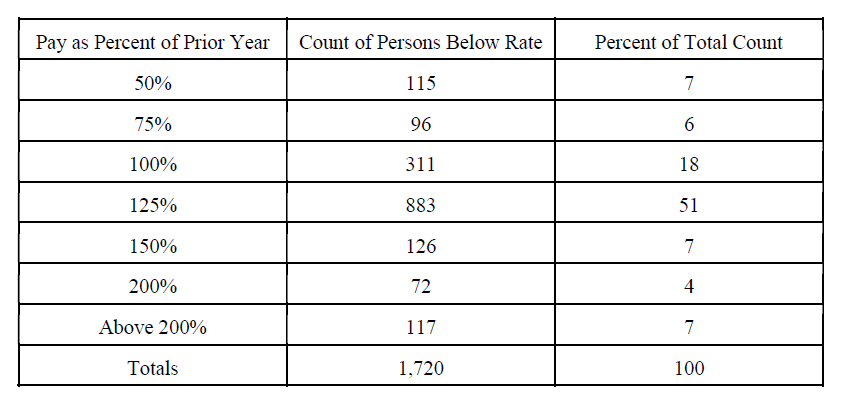
The median rate observed was 101.89%, in that half of the population had lower pay changes, and half had higher changes.
By percentile ranking, 25% were below 96.40% of prior pay, 50% were below the median 101.89% and 75% were below 117.40%.
For a very small portion of the population, pay dipped dramatically one year, then returned to prior levels by the next year. This group accounts for a portion of the outlier results.
This result suggests a reasonable salary growth rate of 2% for actuarial assumptions in small plans. To fully reflect the financial impact of higher pay on benefits, this could be in a range up to 5%.
Service and Termination of Employment
The study population included about 2,750 lives with recorded birth, hire, and termination dates. Years of exposure were recorded by age and length of time from hire to the start of the plan years studied. Separate results were tabulated if a date of termination was recorded in the database.
This leaves a few limitations on the reliability of statistics. While the data includes plans both currently active and previously terminated, some plans previously terminated may have been removed from the study database. No record is compiled for termination reason, whether for voluntary or involuntary leave, nor for death or permanent disablement. Participants who retired and were paid lump sum values were included, as were participants who retired to take recurring distributions.
However, employees who went from paid to unpaid status were not always shown by their actual termination date. We can assume that zero compensation indicates no employment in most participants, and can imply a termination of employment at the beginning of the period with zero pay. However, some business owners may have periods with credited service while their compensation was zero. This includes self-employed who incurred a loss. The termination rates were only measured if a date was present in the database.
Rates were measured for each of the first 10 years of employment, then grouped in five-year bands thereafter. The longest period of service in the data was 38 years. Continued employment records went well beyond age 65, and this study distinguished values through age 71.
The following chart shows the percentage of employees with a termination of service by years of time between hire and termination.
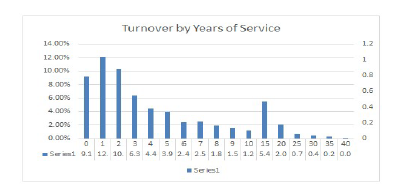
This shows that normal plan operation has high termination rates for the first two years, scaling down below 2% yearly by eight years. Plans with short service employees will find a significant drop through five years. Rates for the five-year intervals (after 10) show the cumulative turnover between end points, so that 5.4% of employees terminated with more than 10 years of service but not more than 15 years, about 1% per year. This drops to very low rates by 20 years and beyond.
Conclusions
Each of the assumptions studied herein show a wide range of actual experience. Small plans have wide variability of compensation changes, employee turnover, plan terminations, and investment results.
Having a published set of rates, the actuary serving small plans can reasonably assume that small compensation increases are appropriate. Employee turnover in the first 5 to 10 years of service can be expected, falling off to insignificant rates by 20 years.
However, plan termination is another decrement to consider in plan forecasting. It justifies an addition to the employee termination rate when making models of future benefits. Especially for small plans, plan termination usually triggers a lump sum payment, either to the participant, to an annuity, or to the PBGC.
Plan asset yields are not an assumption for compliance with IRS minimum funding or tax deduction purposes. However, they are considered in accounting standards, and deserve to be studied in more depth over a longer observation period.
AUTHOR’S NOTE: This study would benefit from broader statistics, including more years of EBSA filings. In addition, it would benefit from participant data provided by other sources. Actuaries who wish to provide additional information are encouraged to select from their plan data sources with properly anonymous data security.
Robert R. Mitchell, MSEA, is an enrolled actuary.
Thanks to Michael F. Morris, MSEA, for assistance with the design of this study.
- Log in to post comments